EKG Secrets: Atrial Depolarization Explained!

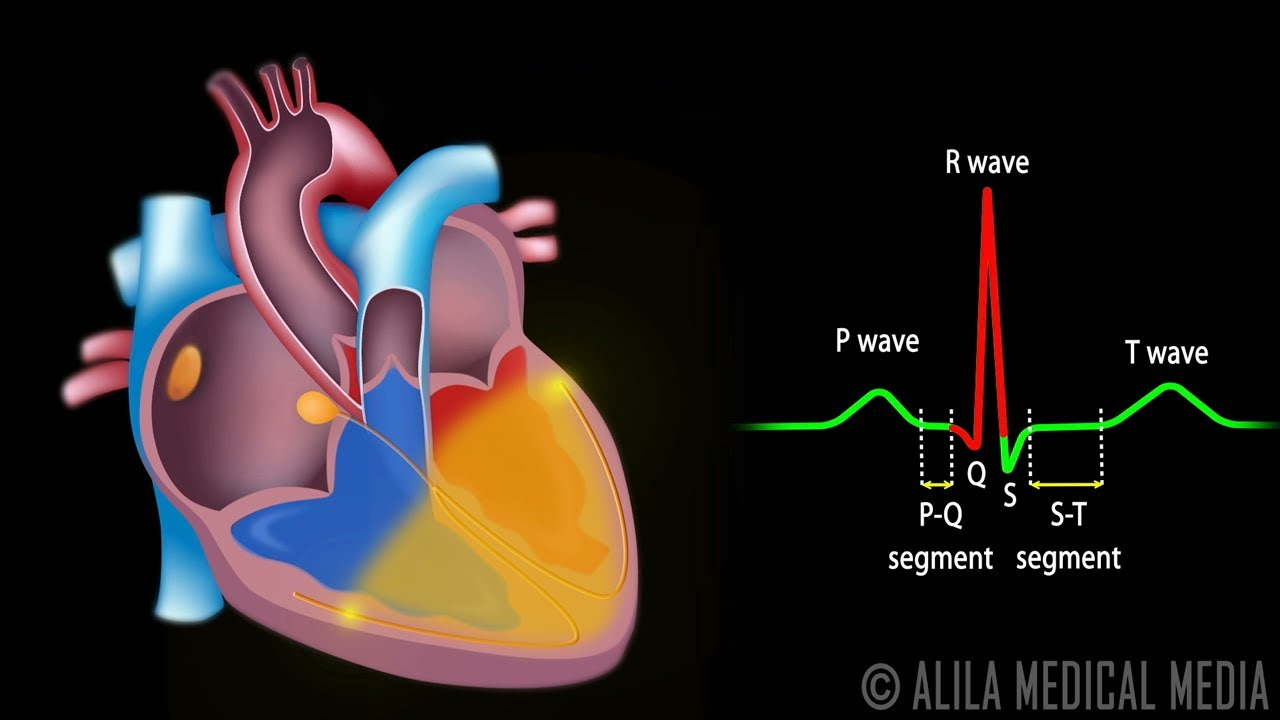
Understanding atrial function is critical in electrocardiography (EKG), a cornerstone diagnostic tool used by institutions such as the American Heart Association (AHA) and extensively researched by pioneers like Dr. Willem Einthoven, the inventor of the EKG. The EKG provides a graphical representation of the heart's electrical activity, where the P wave is the first positive deflection. Therefore, depolarization of the atria is represented on an electrocardiogram by the P wave, which signifies the electrical activation and subsequent contraction of the atria.

Image taken from the YouTube channel RegisteredNurseRN , from the video titled Depolarization and Repolarization of Heart: Action Potential (Atrial & Ventricular) Animation .
The electrocardiogram (EKG or ECG) stands as a cornerstone in modern cardiology. It is a non-invasive diagnostic tool.
Its ability to capture and display the heart’s electrical activity provides invaluable insights into cardiac function.
While much attention is often given to ventricular activity, understanding the intricacies of atrial activity as represented on the EKG is equally crucial.
The EKG: A Window into the Heart's Electrical Activity
The EKG is more than just a squiggly line on a piece of paper. It is a sophisticated graphical representation.
It displays the electrical potentials generated by the heart muscle during each beat.
By placing electrodes on the body's surface, the EKG machine detects and records these electrical signals.
This creates a waveform that allows clinicians to assess the heart's rhythm, identify abnormalities, and diagnose a wide range of cardiac conditions.
Why Atrial Activity Matters
The atria, the heart's upper chambers, play a vital role in cardiac function.
They act as reservoirs, receiving blood from the body and lungs before propelling it into the ventricles.
The coordinated contraction of the atria ensures optimal ventricular filling. It contributes significantly to overall cardiac output.
Therefore, understanding the electrical activity of the atria, as reflected on the EKG, is essential for a comprehensive assessment of cardiac health.
Abnormalities in atrial activity can indicate various underlying conditions.
These range from benign arrhythmias to more serious pathologies. Examples are heart failure and stroke.
Focus: Decoding Atrial Depolarization
This article aims to shed light on how the depolarization of the atria is represented on an electrocardiogram.
We will explore the specific waveform associated with atrial depolarization.
We will delve into its characteristics.
We will also discuss how abnormalities in this waveform can provide clues to underlying cardiac issues.
By the end of this discussion, you will have a clearer understanding of this vital aspect of EKG interpretation.
The Electrical Symphony of the Heart: A Foundation for Understanding
To fully grasp the significance of the P wave and its representation of atrial depolarization, it is essential to first establish a solid understanding of the fundamental principles governing the heart's electrical activity. This involves exploring the cardiac cycle, the processes of depolarization and repolarization, and the crucial roles played by the sinoatrial (SA) node and the atria themselves.
The Rhythmic Dance of the Cardiac Cycle
The cardiac cycle is the complete sequence of events that occurs during one heartbeat. It's a continuous process of coordinated contraction (systole) and relaxation (diastole) of the heart chambers.
Systole forces blood out of the heart, while diastole allows the chambers to fill with blood in preparation for the next contraction. This cycle ensures the continuous circulation of blood throughout the body.
The cardiac cycle can be divided into distinct phases. These phases include atrial systole, ventricular systole, and diastole, each contributing to the efficient pumping of blood.
Understanding the timing and coordination of these phases is crucial for interpreting EKG readings and identifying any deviations from the norm.
Depolarization and Repolarization: The Engine of Contraction
At the heart of cardiac function lie the electrical processes of depolarization and repolarization. These processes drive the contraction and relaxation of heart muscle cells (cardiomyocytes).
Depolarization occurs when the inside of a heart muscle cell becomes more positively charged. This triggers a cascade of events that leads to muscle contraction.
Repolarization, conversely, is the process by which the cell returns to its negatively charged resting state, allowing the muscle to relax.
These rapid shifts in electrical potential are made possible by the controlled flow of ions. Ions such as sodium, potassium, and calcium across the cell membrane.
The EKG captures these electrical changes, displaying them as waveforms that reflect the coordinated activity of millions of cardiomyocytes.
The SA Node: The Heart's Natural Pacemaker
The sinoatrial (SA) node, located in the right atrium, is the heart's primary pacemaker. It spontaneously generates electrical impulses that initiate each heartbeat.
These impulses spread rapidly across the atria, causing them to contract in a coordinated manner. This rhythmic firing of the SA node is what sets the heart's natural rhythm.
The SA node's intrinsic firing rate can be modulated by the autonomic nervous system and hormones. They allow the heart to adapt to changing physiological demands.
Any disruption in the SA node's function can lead to arrhythmias. These are irregular heartbeats that can compromise cardiac output and overall health.
The Atria: Receiving Chambers and Active Contributors
The atria, the two upper chambers of the heart, play a crucial role in the cardiac cycle. They serve as receiving chambers for blood returning from the body and lungs.
The right atrium receives deoxygenated blood from the body via the superior and inferior vena cavae. The left atrium receives oxygenated blood from the lungs via the pulmonary veins.
In addition to their role as reservoirs, the atria also contribute actively to ventricular filling. They contract to propel the remaining blood into the ventricles just before ventricular systole.
This "atrial kick" can significantly boost cardiac output. It becomes particularly important during exercise or other situations where the heart's workload increases.
The processes of depolarization and repolarization, orchestrated by the SA node and executed within the atria, culminate in a visually identifiable event on the EKG. This event, the P wave, serves as a window into the heart's atrial activity, allowing clinicians to assess the health and function of these crucial chambers.
The P Wave: Your Guide to Visualizing Atrial Depolarization on the EKG
The P wave is the first deflection from the isoelectric baseline on a standard EKG. It signifies the electrical activity associated with atrial depolarization. Think of it as the visual signature of the atria contracting.
Defining the P Wave: A Graphical Representation
More precisely, it's the summation of electrical potentials generated by the depolarizing atrial myocardial cells. Each individual atrial cell, when stimulated, contributes a small electrical vector. The EKG machine records the composite of all these vectors, displaying it as the P wave.
This wave therefore is not simply a marker. It is a dynamic representation of the overall electrical behavior of the atria.
Unpacking the P Wave: Electrical Activity Unveiled
The P wave originates with the firing of the sinoatrial (SA) node. This node is located in the high right atrium.
The electrical impulse then spreads outward. It traverses both atria, causing them to contract and push blood into the ventricles.
The shape, size, and duration of the P wave provide valuable information. They reveal how efficiently and uniformly this impulse is conducted across the atria.
Bachmann's Bundle and Internodal Pathways: The Conduction Network
The spread of the impulse isn't random. It follows specialized conduction pathways.
Bachmann's bundle is one such pathway, facilitating rapid conduction from the right atrium to the left atrium. This ensures coordinated contraction.
Internodal pathways further refine this process. They provide preferred routes for the impulse to travel within the right atrium.
These specialized routes optimize the timing and sequence of atrial depolarization. This is reflected in the P wave morphology.
Normal P Wave Characteristics: Morphology, Amplitude, and Duration
A normal P wave has specific characteristics. Deviations from these indicate potential atrial abnormalities.
-
Morphology: Typically, the P wave is smooth and rounded. It has a positive deflection in most leads, particularly Lead II.
-
Amplitude: The normal amplitude of the P wave is less than 0.25 mV (2.5 mm) in height.
-
Duration: The normal duration of the P wave is between 0.06 and 0.12 seconds.
These parameters offer a baseline for comparison. They help identify pathological changes in atrial function.
The PR Interval: A Gateway to Atrioventricular Conduction
The PR interval is measured from the beginning of the P wave to the start of the QRS complex. It represents the time it takes for the electrical impulse to travel from the atria through the AV node. It then moves down into the ventricles.
A normal PR interval ranges from 0.12 to 0.20 seconds.
Prolongation or shortening of the PR interval can indicate AV node dysfunction or accessory pathways. Both of these are significant cardiac conduction issues.
The PR interval bridges the gap between atrial and ventricular activity. It provides a crucial link in EKG interpretation.
The shape, size, and duration of the P wave offer invaluable insights into atrial health. But what happens when these parameters deviate from the norm? A distorted or absent P wave isn't just an anomaly; it's a potential red flag, signaling underlying atrial pathology.
Decoding P Wave Abnormalities: Recognizing the Warning Signs
Abnormalities in the P wave serve as crucial indicators of underlying atrial pathologies. A keen understanding of these deviations is paramount. It enables clinicians to identify and manage a spectrum of cardiac conditions effectively.
P Wave Morphology: A Window into Atrial Health
The P wave's shape, height (amplitude), and width (duration) are all key elements. These elements reflect the health and function of the atria. Deviations from the expected morphology often point to specific underlying issues.
-
Peaked P Waves: Tall, pointed P waves, particularly in leads II, III, and aVF, may suggest right atrial enlargement (P pulmonale). This can be seen in conditions like pulmonary hypertension or tricuspid valve stenosis.
-
Notched or Wide P Waves: A P wave that is wider than normal (greater than 0.12 seconds) or has a notched appearance may indicate left atrial enlargement (P mitrale). This is often associated with mitral valve stenosis or systemic hypertension.
-
Inverted P Waves: A P wave that is inverted in leads where it should be upright (like lead II) can suggest ectopic atrial rhythms. The impulse originates from somewhere other than the SA node.
-
Absent P Waves: The absence of discernible P waves is a hallmark of conditions. Atrial fibrillation is one of these conditions. The absence indicates that the atria are not depolarizing in a coordinated fashion.
Unmasking Arrhythmias: The P Wave's Role
P wave analysis plays a pivotal role in diagnosing various atrial arrhythmias. Each arrhythmia presents with unique P wave characteristics. These characteristics serve as diagnostic clues.
-
Atrial Fibrillation: Characterized by the absence of distinct P waves. Replaced by fibrillatory waves (f waves). The baseline appears erratic and irregular. Ventricular response is also typically irregular.
-
Atrial Flutter: Sawtooth pattern of flutter waves (F waves), best seen in the inferior leads (II, III, aVF). These waves represent rapid, repetitive atrial depolarization.
-
Ectopic Atrial Tachycardia: Abnormal P wave morphology (different from the sinus P wave). This indicates that the atrial depolarization originates from a site other than the SA node. The heart rate is typically rapid (greater than 100 bpm).
-
Wandering Atrial Pacemaker: Varying P wave morphology. This indicates that the pacemaker site is shifting between the SA node, atria, and/or AV junction. The heart rate is usually within normal limits.
The Heart Rate Connection: Its Impact on the P Wave
Heart rate significantly influences P wave morphology and the overall EKG interpretation.
- Tachycardia (Fast Heart Rate): At rapid heart rates, the P wave may merge with the preceding T wave. This makes it difficult to distinguish and analyze accurately.
- Bradycardia (Slow Heart Rate): At slower heart rates, the P wave is more easily discernible. This allows for more detailed assessment of its morphology and relationship to other EKG components.
It's crucial to consider the heart rate when interpreting P wave abnormalities. Changes in heart rate can alter the appearance of the P wave. This can potentially mask or mimic certain pathological conditions.
Decoding the P wave and understanding its variations provides a foundation for more advanced analysis. Now, we turn our attention to how this knowledge translates into real-world clinical applications and how P wave interpretations are used in practice.
Clinical Significance and Interpretation: Putting It All Together
The P wave, though seemingly a small component of the EKG, carries substantial weight in diagnosing a wide array of cardiac conditions. Its morphology, duration, and relationship to other EKG elements provide critical insights into atrial function and overall cardiac health.
The P Wave as a Diagnostic Cornerstone
The P wave serves as a crucial early indicator of various underlying heart problems. It provides valuable information about the heart's electrical activity. Changes or abnormalities in the P wave often precede more significant cardiac events. Detecting these early warning signs can lead to earlier diagnosis and treatment.
- Rhythm Disturbances: The P wave helps identify various arrhythmias, such as atrial fibrillation, atrial flutter, and ectopic atrial rhythms.
- Atrial Enlargement: Changes in P wave amplitude and duration are key indicators of atrial enlargement, a common consequence of hypertension, valve disease, and heart failure.
- Conduction Blocks: Assessing the PR interval (the time from the beginning of the P wave to the start of the QRS complex) helps diagnose atrioventricular (AV) blocks, which can disrupt the normal flow of electrical impulses from the atria to the ventricles.
Clinical Implications of Abnormal P Wave Findings
When P wave morphology deviates from the norm, it's imperative to understand the clinical implications. Abnormalities can range from relatively benign to life-threatening, requiring careful evaluation and tailored management strategies.
For instance, peaked P waves (P pulmonale) are often associated with pulmonary hypertension, a serious condition that increases the workload on the right side of the heart. Similarly, wide or notched P waves (P mitrale) suggest left atrial enlargement, frequently seen in patients with mitral valve stenosis or systemic hypertension. The absence of P waves could point to conditions like atrial fibrillation.
Understanding the specific clinical context in which these P wave abnormalities occur is crucial. This includes the patient's medical history, physical examination findings, and results from other diagnostic tests.
Integrating the P Wave with Other EKG Components
Analyzing the P wave in isolation is rarely sufficient for a comprehensive cardiac assessment. The P wave must be integrated with other EKG components, such as the QRS complex and T wave. Analyzing the P wave in combination with these can provide a more complete picture of the heart's electrical activity.
- QRS Complex: The QRS complex represents ventricular depolarization. Its morphology and duration, in conjunction with the P wave, helps diagnose conduction abnormalities, ventricular hypertrophy, and bundle branch blocks.
- T Wave: The T wave reflects ventricular repolarization. Changes in T wave morphology, such as inversion or flattening, along with P wave abnormalities, may indicate ischemia, electrolyte imbalances, or drug effects.
- PR Interval and AV Blocks: Careful assessment of the PR interval, which reflects atrioventricular conduction time, is essential for diagnosing various AV blocks. Prolongation of the PR interval suggests a first-degree AV block, while complete absence of a relationship between the P waves and QRS complexes indicates a third-degree AV block.
By carefully integrating the P wave with other EKG components, clinicians can make more accurate diagnoses and develop appropriate treatment plans. This holistic approach ensures that all aspects of cardiac electrical activity are considered, leading to improved patient outcomes.
Video: EKG Secrets: Atrial Depolarization Explained!
EKG Secrets: Atrial Depolarization Explained! - FAQs
[This section answers common questions about atrial depolarization and its representation on an EKG, helping you understand this key cardiac event.]
What exactly does atrial depolarization mean?
Atrial depolarization refers to the electrical activation of the atria, the two upper chambers of the heart. It's the process that initiates atrial contraction, pushing blood into the ventricles.
How can I identify atrial depolarization on an EKG?
The depolarization of the atria is represented on an electrocardiogram by the P wave. The P wave's shape, size, and timing provide important clues about atrial health.
What can abnormal P waves tell me?
Abnormalities in the P wave, such as being too tall, wide, or inverted, can indicate various atrial problems. These include atrial enlargement, atrial arrhythmias like atrial fibrillation or flutter, or other heart conditions.
Why is understanding atrial depolarization important?
Recognizing and understanding atrial depolarization is crucial for diagnosing heart conditions. The depolarization of the atria is represented on an electrocardiogram by the P wave, whose characteristics are key to identifying arrhythmias and other atrial pathologies, enabling timely treatment.